Tutorial: Simulate wind velocity on a sign post
-
Study type=Linear Static
-
Load type=Pressure
-
Constraint type=Fixed
-
Mesh type=Mixed and General Bodies
-
Connector type=Glue
-
Open FE_street_sign.asm.
Simulation models are delivered in the \Program Files\UDS\QY CAD 2022\Training\Simulation folder.

-
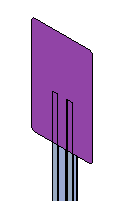
Expose the mid-surface for the sign.
-
In the graphics window, in Assembly PathFinder, right-click sign.psm and select Show / Hide Component....
-
In the Show / Hide Component dialog box, select the following:
-
Surfaces=On
-
Design Body=Off
-
-
-
Create a study.
-
Select Simulation tab→Study group→New Study.

-
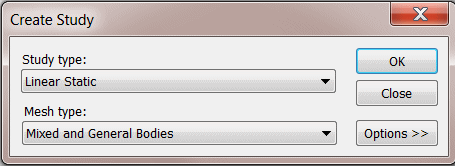
In the Create Study dialog box, select the following:
-
Study type=Linear Static
-
Mesh type=Mixed and General Bodies
The Select Occurrences command
 is now active.
 -
-
At the prompt, Select one or more occurrences and/or mid-surfaces and/or united bodies to include in the study, select both the mid-surface of the sign and the post.
 Note:
Note:You could also select the sign and sign_post from PathFinder.
-
Click Accept on the command bar.
-
-
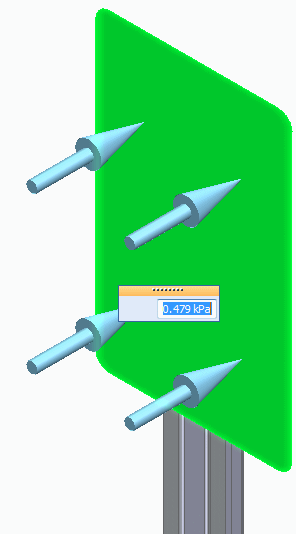
Define a 0.479 kPa (10 lb/in2) pressure on the sign. This pressure value approximates a wind velocity of 127 kph (79 mph).
-
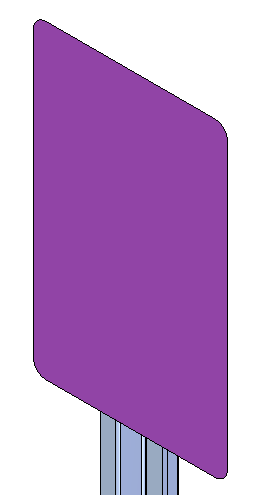
Zoom in to view the sign.
-
Select Simulation tab→Structural Loads group→Pressure.

-
Select the front face of the sign and type 0.479 kPa in the value box. Press Enter.
-
Click to finish and accept the pressure.
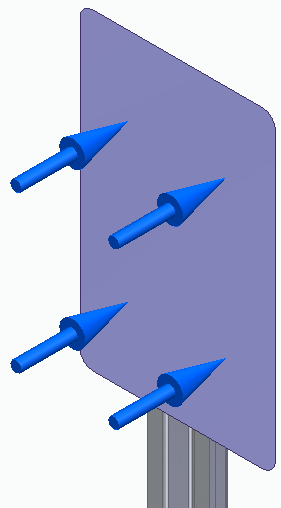 Note:
Note:You can change the size and spacing of the load, constraint, and assembly connector symbols using the Graphic Symbol Size dialog box. To learn how, see Modify FEA symbol properties.
-
-
Define a fixed constraint near the bottom of the sign post.
-
Use the Zoom Area command around the bottom of the post.
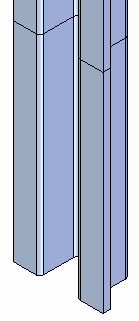
-
Select Simulation tab→Constraints group→Fixed, and then drag a box around the bottom faces of the post.
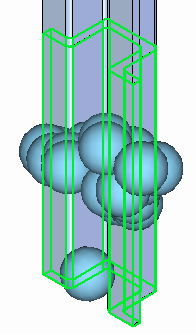
-
Right-click to accept the constraint.
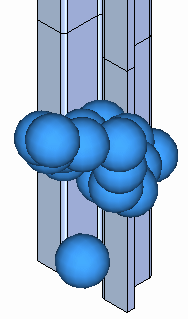
-
-
Define assembly connectors between the post and the sign.
-
Select Glue as the Connector type.
-
Click Single connection per face pair
 .
. -
Change the Search distance to 2 mm.
-
Click Select All
 to select both the post and sign.
-
Click Accept on the command bar.
The connector pair information is displayed in the Results dialog box.
-
In the Results dialog box, select the connector entry (1: sign_post.par1,sign.psm1), and then click the Create Connectors button.
In this example, only one connector pair is listed.
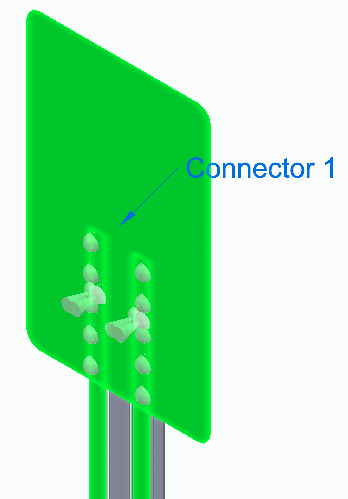
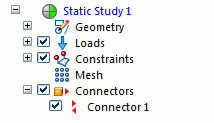
In the Simulation pane, you can see that Connector 1 was created

-
Now turn off the Loads and Constraints.
-
In the graphics window, zoom in on the top and then the bottom of the assembly.
Observe the following:
-
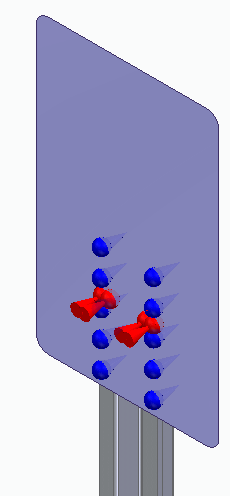
On sign.psm at the top, both connector target symbols (red) and connector source symbols (blue) are shown where the glue connectors were created between the two parts.
-
At the bottom of sign_post.par, only the red connector target symbols are shown.
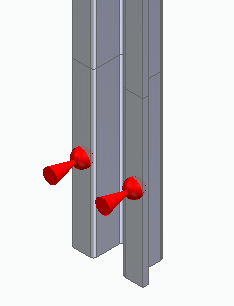
Note:In the graphics window, the assembly connector symbols are color-coded to make it easier to identify the target faces and source faces for editing. You can use this information to identify and replace target and source connection regions in a glue or no penetration contact connection. For more information, see Target and source connector regions
This symbol
Represents

Connector target

Connector source
-
-
Mesh and solve the study.
-
Turn off the Connectors node in the Simulation pane.
-
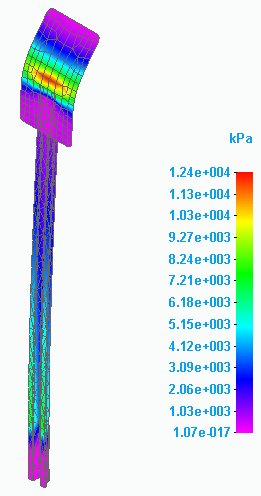
Select the Mesh command. Choose Mesh & Solve.
The results are displayed in the Simulation Results environment.
-
-
Save and close this file.
Use linear static analysis to identify the stresses due to air pressure (as measured by wind speed) on a sign post. The sign post assembly contains both a solid part and sheet metal part, which requires a mixed mesh (tetrahedral and surface).
The study parameters used in this tutorial are:
© 2021 UDS
