Modal frequency analysis
When to use modal frequency analysis
In QY CAD Simulation, modal frequency analysis is normal modes analysis. Use it to find the frequencies at which a part or assembly vibrates freely. The results of a normal modes analysis identify the natural frequencies (frequencies of free vibration) and mode shapes (the shapes of deformation) of your design. The objective is for you to be able to verify that the natural frequencies and mode shapes do not approach the known critical operating frequencies required for your design.
A sorting machine operates at 60 Hz. Upon startup, the machine cycles from 0 Hz up to the operating speed. Modal analysis reports that the first two natural frequencies are 27.5 Hz and 59 Hz. This will cause reliability problems as the loads applied are amplified at the natural frequency.
All rotating components, such as a propeller rotating on a shaft, or blades rotating on a windmill, can be evaluated with respect to defined limits on their revolutions-per-minute. If the natural frequency of the supporting structure is close to an operating frequency of the component, then there can be significant dynamic amplification of the loads.
-
To apply modal analysis, choose the Normal Modes study type on the Create Study dialog box.
-
For an example of how to define and review the results of a normal modes study, try the Tutorial: Perform a modal analysis.
Concepts of normal modes analysis
Normal modes analysis forms the foundation for understanding the dynamic characteristics of an object subject to cyclical forces at periodic intervals.
Normal modes analysis computes the natural frequencies and mode shapes of a structure. When a structure is disturbed or excited, its motion will be a linear combination of the natural frequencies of the structure. The natural frequencies (normal modes) are a fundamental characteristic of the structure and are a function of the stiffness and mass of the structure. For example, the strings of a piano are each tuned to vibrate at a specific frequency with a specific input. The deformed shape at a specific natural frequency is called the mode shape.
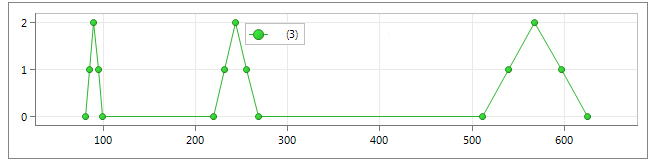
The XY plot below from Femap help shows three peaks, one peak for each of the first three modes. The Y value is arbitrary on this plot, but the X values are an excellent way to visualize where the excitations are occurring with respect to the frequency range. Also, the width of the base of each peak represents the frequency bandwidth associated with each frequency.
In normal modes analysis, we solve for the eigenvalues and eigenvectors of the model. For each eigenvalue, which is proportional to a natural frequency, there is a corresponding eigenvector, or mode shape. (This is why normal modes analysis is also called real eigenvalue analysis.)
Normal modes analysis is performed for many reasons, among them:
-
Assessing the effects of design changes on the base dynamic characteristics.
-
Using the modes in a subsequent harmonic response analysis.
-
Using the natural frequencies as a guide to selecting the proper time or frequency step for transient and frequency response analyses, respectively.
-
Assessing the degree of correlation between modal test data and analytical results.
© 2021 UDS