Constraint component plots
When you select Constraint Force from the Result Type list in the Data Selection group, you can review the simulation results in any of the following constraint component plots:
-
Constraint force data plots
-
Constraint moment data plots
Constraint force data plots
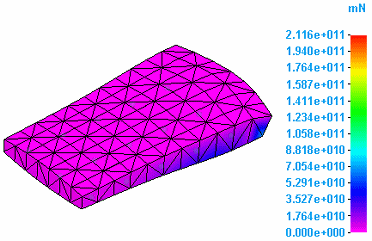
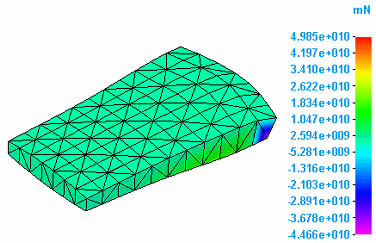
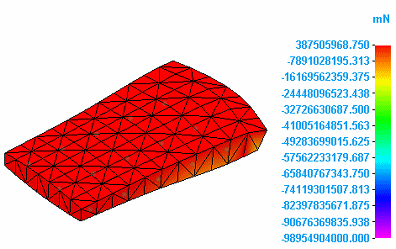
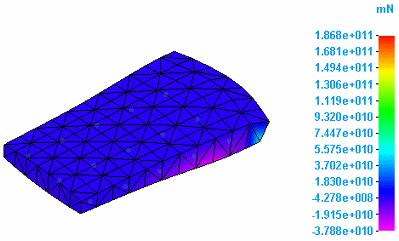
Constraint force data plots show the effect on part geometry of a force implied by a constraint. Select the following constraint force data types from the Result Component list in the Data Selection group:
The T1, T2, and T3 components are equivalent to the X, Y and Z axes in QY CAD.
-
Total Constraint Force—
-
T1 Constraint Force
-
T2 Constraint Force
-
T3 Constraint Force
Constraint moment data plots
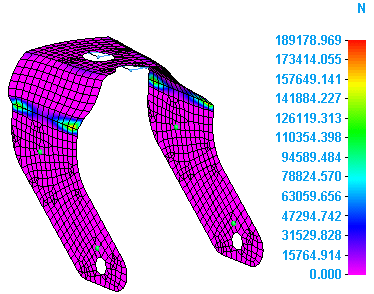
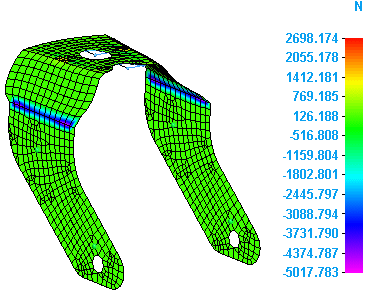
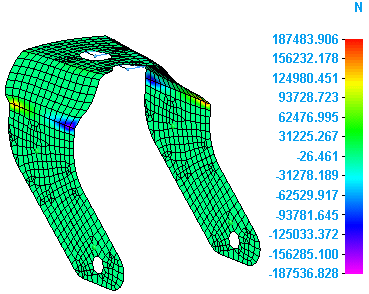
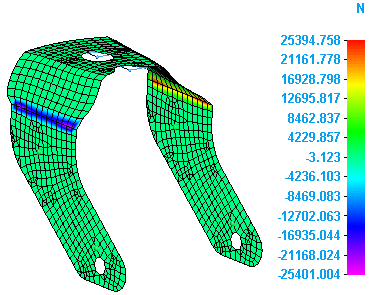
You can plot the effect on part geometry of a moment implied by a constraint. Select the following constraint moment data types from the Result Component list in the Data Selection group:
-
Total Constraint Moment
-
R1 Constraint Moment
-
R2 Constraint Moment
-
R3 Constraint Moment
© 2021 UDS