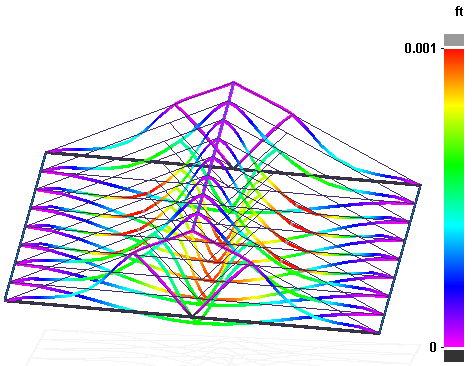
Adjust the color bar


The color bar is visible in the Simulation Results environment when you are reviewing the model with contour colors. Use the options on the ribbon to display it and modify its appearance.

Do any of the following:

To

Do this

Display the color bar.

Select both of these check boxes:

  • Home tab→Show group→Contour.

  • Color Bar tab→Show group→Color Bar.

Move the color bar.

  • Click one of the following buttons on the Color Bar tab→Position group to move it with respect to the geometry in the analysis results window.

    • Right side

    • Left side

Change the color bar color spectrum.

From the Color Bar tab→Colors group→Spectrum list, choose a different color spectrum.

Remove magenta from the contour colors.

In the Color Bar tab→Colors group, select the No Magenta check box.

Display a descriptive heading.

  1. Select the Header check box on the Color Bar tab→Show group.

  2. Click one of the Header icons on the Color Bar tab→Position group to position the heading at the top-left or bottom-left of the analysis results window.

Display minimum and maximum value markers.

On the Color Bar tab→Show group, select the following check boxes:

  • Min Marker

  • Max Marker

Change the color bar width.

The default color bar width is Normal.

  • On the Color Bar tab→Format group→Color Bar Width list, choose one of the following:

    • Thick

    • Thin

Change the numeric value format.

  1. (Numeric format) From the Color Bar tab→Format group→Number Format list, choose Automatic. This allows the program to choose the best notational format for the actual results.

    Tip:
    • To specify the notational format, choose either Scientific or Floating from the list.

    • Values that are too low or too high may show as 0 values.

  2. (Decimal places) From the Color Bar tab→Format group→Number Of Decimal Places list, select an integer from 0 through 16 using one of these techniques:

    • Click an up or down arrow.

    • Click in the box, and then scroll the mouse wheel to change the value.

Apply a user-defined scale to the color bar legend.

Note:

The default scale is Automatic.

  1. On the Color Bar tab→Scale group, select User Defined.

  2. In the Min box, type a minimum value for the user-defined scale.

  3. In the Max box, type a maximum value for the user-defined scale.

Tip:

With a user-defined scale, you also can use the Underflow and Overflow check boxes in the Colors group to identify values that fall below or exceed the scale results.

Specify underflow and overflow colors on the color bar.

For an example, see Using the Color Bar.

  1. On the Color Bar tab→Scale group, select User-Defined Scale.

  2. (Specify underflow) On the Color Bar tab→Colors group, do the following:

    1. Select the Underflow check box, and then click the Underflow Color button beside it.

    2. In the Color dialog box, click a color box, and then click OK to apply it.

  3. (Specify overflow) On the Color Bar tab→Colors group, do the following:

    1. Select the Overflow check box, and then click the Overflow Color button beside it.

    2. In the Color dialog box, click a color box, and then click OK to apply it.

Tip:

These options are available only with a User-Defined Scale. When you are done specifying overflow and underflow colors, you can change the scale option and still maintain these settings.